Dynamic Stability Derivative computation using Lattice Boltzmann Method
Dynamic Stability Derivatives (DSD) are one of the key parameters for maneuverability and stability of an aircraft. DSDs are calculated by oscillating the aircraft about different axes at suitable frequencies. DSDs allow the aircraft designer to (1) determine the dynamic stability characteristics of the vehicle; (2) provide inputs for the control system design; and (3) support the trajectory design and optimization.
The design and testing phases of an Unmanned Aerial Vehicle (UAV) includes the following tasks:
Estimation of combined DSDs of UAV
Separation of individual components of dynamic derivatives
In this study, we compute combined rolling dynamic derivatives of Saccon UAV, shown in Figure 1. Here, a freestream velocity of 18 m/s is considered, which results in Reynolds number of 5.688 x 10⁵ and Mach number of 0.15. The half wingspan is 0.769 m, while the wing chord at the root is 0.479 m. We consider the Angle of Attack to be 14° with roll oscillation amplitude and frequency being 5° and 1 Hz, respectively.
Figure 1 Saccon UAV geometry
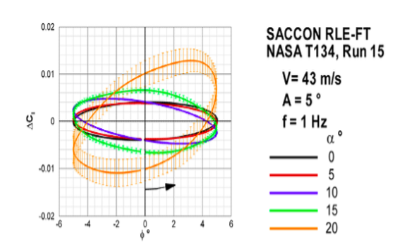
Figure 2 Roll oscillation rolling moment coefficient loop at different angles of attack [1]
The UAV is subjected to multiple cycles of sinusoidal roll oscillations and the rolling moment coefficient is plotted against φ (roll angle). Each multi-cycle sinusoidal data is condensed to a one-cycle phase-averaged loop, as shown in Figure 2.
At SankhyaSutra Labs, we use an inhouse entropic Lattice Boltzmann method to obtain the transient simulation data to calculate DSDs. To derive combined DSD from the oscillation data, we use the Single Point Method.
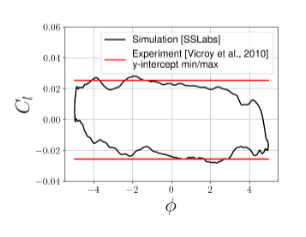
Phase-averaged roll moment coefficient is plotted against the roll-angle leading to a hysteresis curve as shown in Figure 3. Similar to the experiments, a slight shift is seen in the hysteresis curve in the y-direction, which is corrected to obtain a symmetrical curve about the x-axis. The y- intercepts from the experiments are presented for comparison. The minimum y-intercept is predicted with an error of 12% and the maximum y-intercept is predicted with an error of 8%. These accurate predictions demonstrate the suitability of SankhyaSutra Lab’s LBM method for calculating DSDs.
Fig 3: Phase-average of time-averaged rolling moment coefficient hysteresis loop
References
Vicroy, Dan D., Thomas D. Loeser, and A. Schütte, SACCON forced oscillation tests at DNW-NWB and NASA Langley 14X22-foot tunnel, 28th AIAA Applied Aerodynamics Conference, 28, 2010.