Aerodynamic Analysis of Unmanned Aerial Vehicle (UAV) in Stall Regime
Recent developments in computing infrastructure and simulation methods have made the aerodynamic study of full unmanned aerial vehicle (UAV) feasible at a reasonable cost. To predict separation of flow for UAVs accurately, one needs to carry out highly accurate transient simulations. SankhyaSutra Taral, an Entropic Lattice Boltzmann Method (ELBM) solver, can help the user understand such phenomena.
The higher order ELBM solver
leads to improved stability, accuracy, and thermal properties over a broad range
of Mach numbers. ELBM does not use an explicit turbulence model and allows a
seamless transition from Large Eddy Simulation (LES) to Direct Numerical
Simulation (DNS) by increasing the grid resolution.
In this study, aerodynamics analysis for a conventional UAV with
wing-body-tail configuration is studied for different Angles of Attack (AoAs)
including flow separation regime. The simulation results are compared with the
wind tunnel experiments performed in NASA Langley’s stability tunnel. This
geometry consists of an unswept wing with an aspect ratio of 6, a fuselage with
fineness ratio of 7.5, and an unswept vertical and horizontal tail with an
aspect ratio of 2 and 4, respectively. The wing section has a NACA 65A008
airfoil cross-section.
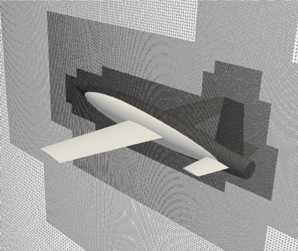
Figure 1: Multi-Resolution Grid for UAV simulation
Wing-body-tail configuration is simulated at three AoAs, namely 80 (pre-stall region), 160 (near-stall region) and 200 (post-stall region). Figure 1 shows the multi-resolution mesh used for the simulations. Here, nine levels of grid refinement can be noted, where the grid resolution changes across consecutive levels by a factor of two.
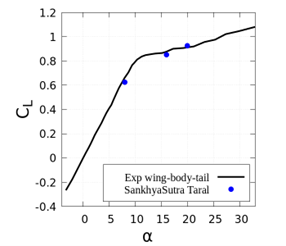
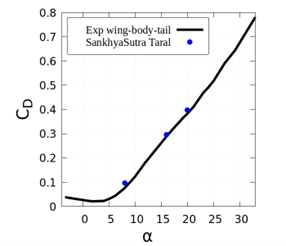
Figure 2 shows the trend in lift and drag coefficients for the wing-body-tail configuration. Results show good agreement with the experimental results, considering the separation dominates the flow, especially at higher AoAs.
(a)
(b)
Figure 2: Lift (a) and drag (b) coefficient for UAV with wing body tail configuration
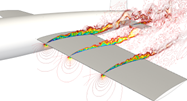
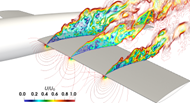
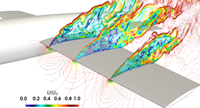
Figure 3 shows the velocity contours at 80,160, and 200. Here, one may notice large scale separation on the wing’s upper surface leading to loss in lift generated. At higher AoA, the separation point moves towards the leading edge due to increase in flow separation leading to stall. These results reinforce that SankhyaSutra Taral solver can simulate the separated flow with complex geometries like UAVs.
(a)
(b)
(c)
Figure 3: Velocity Contour Slices on the wing at different spanwise location for complete wing-body-tail configuration for AoA of 80(a) 160 (b) 200 (c)