The Ahmed model was created by S R Ahmed in
1984, and was designed to be a simple geometry that was capable of replicating
complex flow structures involved in the flow past an automobile. It has evolved
into a benchmark problem for CFD solvers aiming to capture accurately the flow
features of an automobile.
The Ahmed model comprises of three major
regions of interest, namely – the front curved region (Ck*), the rear slant
region (Cs*), and the rear flat region (Cb*) that contribute over 90% of the
total pressure drag experienced by the geometry. The quantities monitored in
the study of the Ahmed model include but are not limited to – the total drag,
velocity profile plots, and wake velocity contours.
Figure 1: Ahmed Body
2. Simulation Setup
The current study aims to capture the aerodynamic characteristics of the Ahmed Body geometry with a slant angle of 25 degrees at Reynolds Number Re = 0.768 Million based on the vertical height of the Ahmed model geometry. High fidelity simulations have been conducted with the robust in-house Lattice Boltzmann solver.
The solver makes use of a structured multi-resolution grid arrangement and Body Centered Cubic (BCC) arrangement of grid points is used for spatial discretization. No explicit turbulence models have been used in this study.
3. Simulation Results
The drag, lift, and pressure coefficients have been reported at different grid resolutions and/or arrangements, and have been validated against the results of Ahmed et al. The wake flow has been studied, and averaged velocity profiles have been compared with experimental findings.
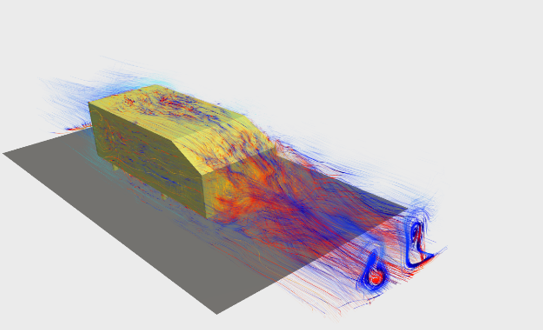
Figure 2: Flow - averaged streamlines in the symmetry plane of the Ahmed body domain
3.1 Velocity Profiles
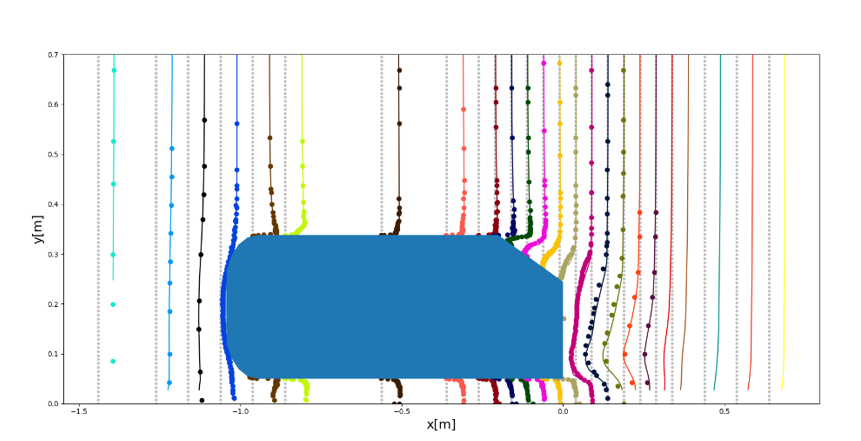
The rear slant angle of the Ahmedbody has a considerable effect on the flow separation at the rear end and the 25 degree configuration, particularly, is the one of the critical cases where flow experiences both flow separation and reattachment over the rear slant surface. The streamwise component of the velocity profiles at the plane of symmetry (z=0) compared with the experiments have been compared in the following figure. Predictions are in excellent agreement with the experimental findings.
Figure 3: Velocity field values at different x-locations in the symmetry plane of the Ahmed body domain are represented as dots, and are compared with experimental values (Lienhart and Becker, 2003) which are represented as curves.
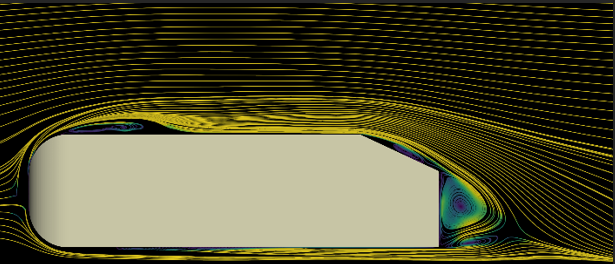
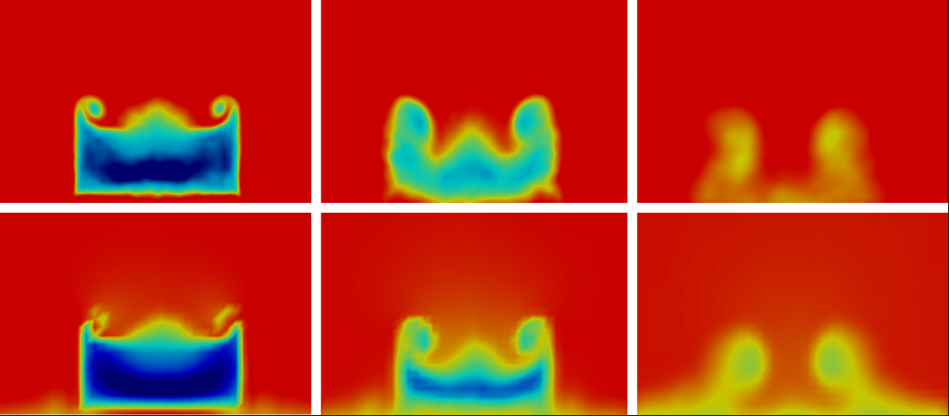
The three-dimensional flow structures in the wake, formed by the interaction of flow with the geometry, are captured with adequate accuracy. The counter rotating C-pillar vortices that energise the wake flow, are compared against the experimental measurements in the following figure. The figure clearly shows the recirculation regions in the wake, which are in agreement with experiments.
Figure 4: Wake velocity contours at a distance of 80mm, 200mm, and 500mm, respectively (left to right) from the rear end of the Ahmed model compared with experiments (bottom) (Lienhart and Becker, 2003)
3.2 Drag and Lift
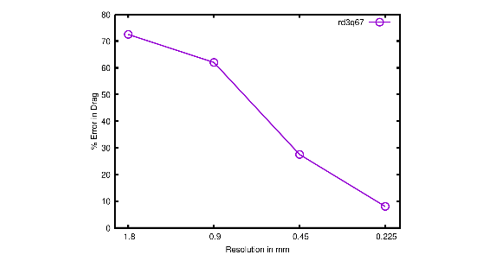
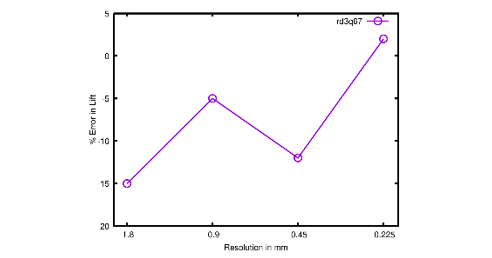
The error in predicted force values, in well resolved simulations, is within the widely accepted industry-level threshold of 5 percentage. This can be further improved by increasing the resolution depending on the availability of computational resources. It should be noted that no turbulence models were used in all the simulation results reported.
Figure 5: Percentage error in drag force with increase in geometry resolution
Figure 6: Percentage error in lift with increase in geometry resolution
3.3 Pressure Distribution
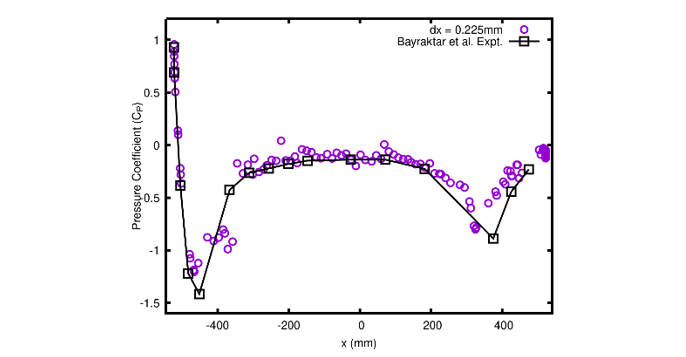
Pressure distribution on the mid plane compared with experimental pressure values is shown in the following figure. This plot aids in quantitatively identifying the flow separation and reattachment zones over the surface of the geometry.
Figure 7: Pressure distribution compared with experimental values